Triage Speed
15+ Hours/Week Saved
Stop manual data exports and pivot tables. Get instant period-over-period delta reports.
Decision-Ready SEO Intelligence
Most SEO teams drown in data but starve for action. Nuwtonic's GSC Performance Dashboard filters out the noise, surfacing the exact pages and queries that will move your revenue needle.

We replace manual spreadsheet analysis with real-time, actionable insights for your entire content and SEO department.
Triage Speed
15+ Hours/Week Saved
Stop manual data exports and pivot tables. Get instant period-over-period delta reports.
Execution Confidence
4x Faster Implementation
Move straight from data to task with clear prioritization and impact forecasting.
Reporting Clarity
0 Data Noise
Align stakeholders around core KPIs and proven growth, not just vanity metrics.
The dashboard is designed to lead your team through a logical optimization funnel, from high-level situational awareness to granular execution.
Identify at-risk pages before they collapse entirely. Our system flags trend breaks in real-time.
Find high-impression, low-CTR queries where your snippets are failing to capture existing demand.
See exactly where Google trusts you and where your topical authority clusters are thinning out.
Explore how each module helps you navigate the complex journey from raw data to organic revenue.
Step 1
Leadership and managers need one single view to align on current status without scanning complex reports.
The SEO Friction
Teams lose focus when core metrics are scattered across different filters and tools.
The Data Evidence
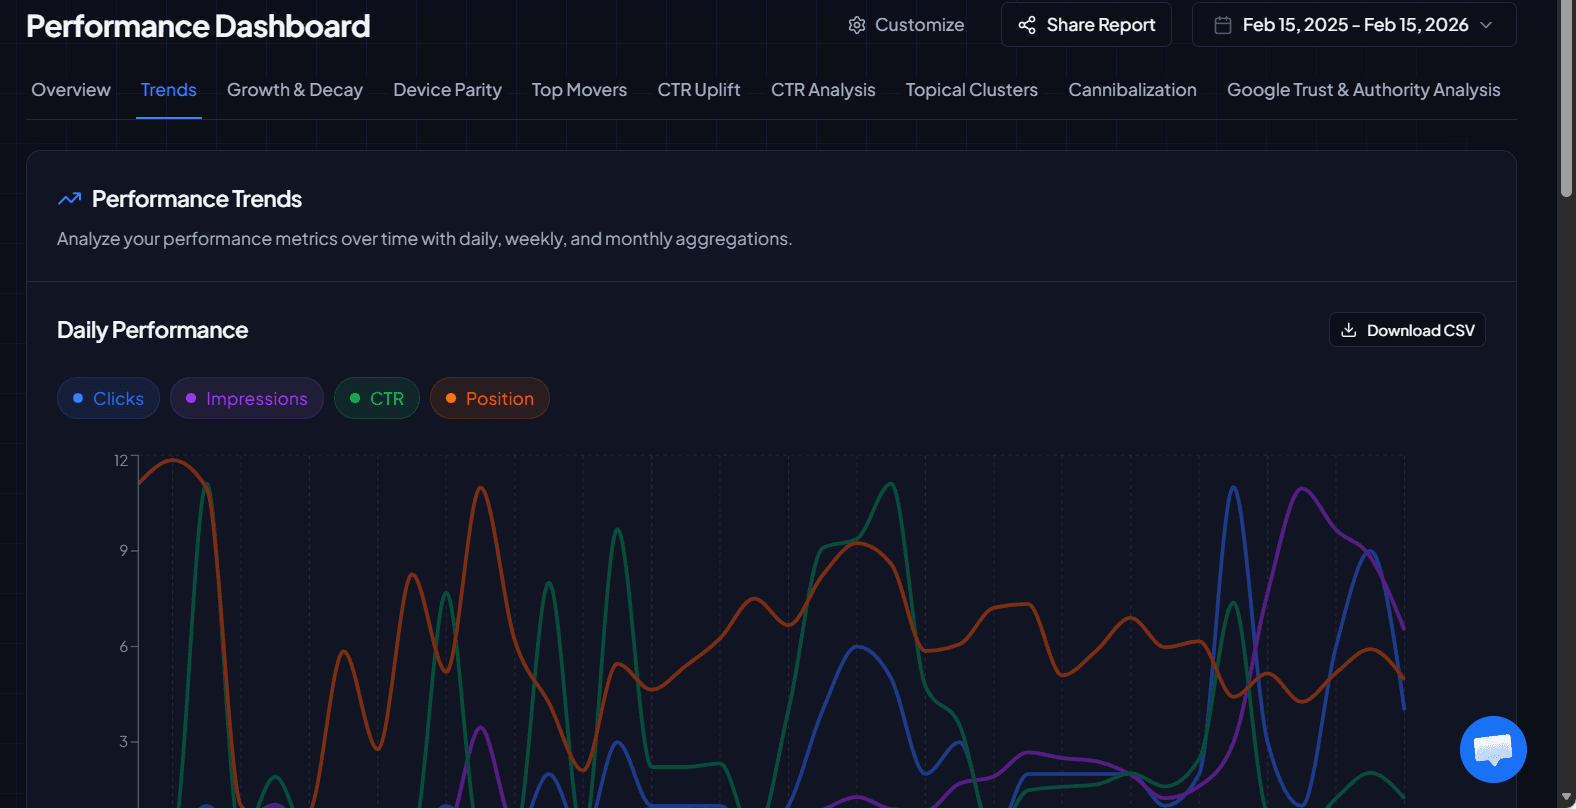
Unified view of clicks, impressions, CTR, and average position with period-over-period comparisons.
The Strategic Action
Use this as your weekly baseline to set the team's high-level priorities.
The Business Outcome
Faster executive alignment and fewer meetings spent clarifying current performance.
Step 2
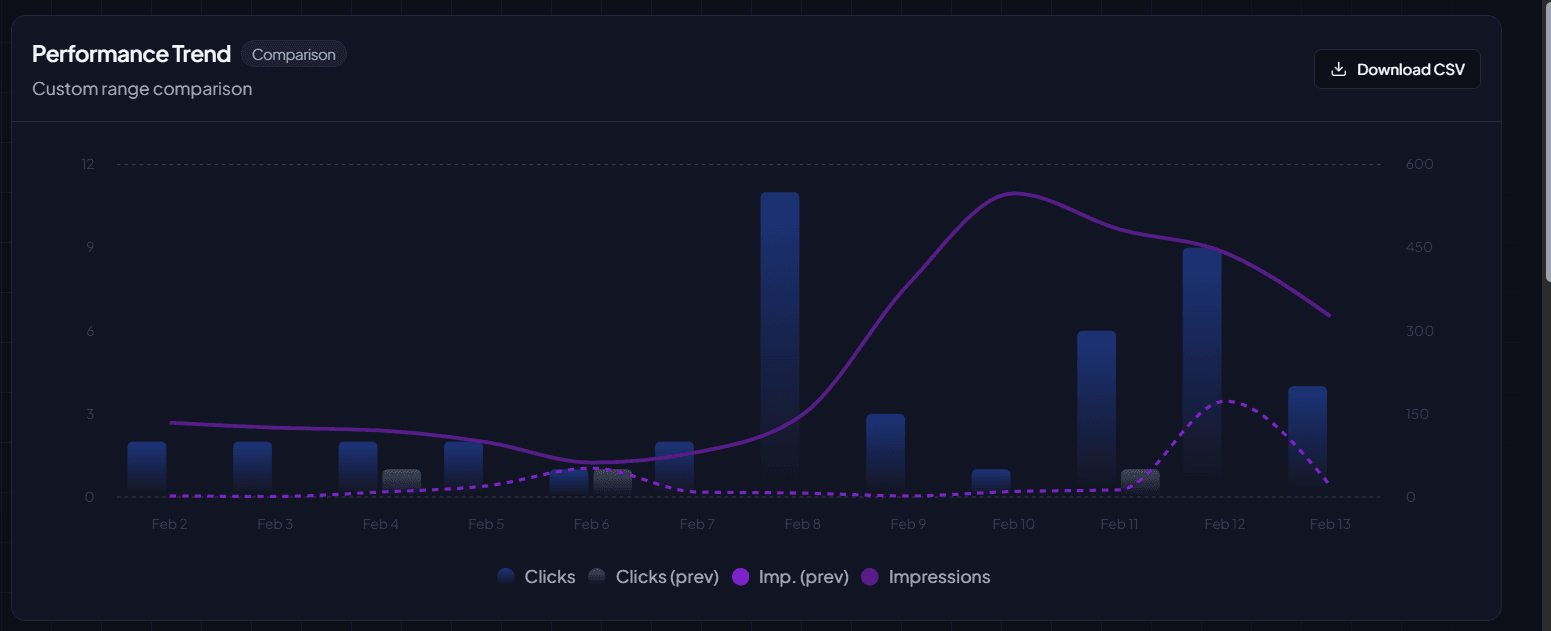
You need to understand the relationship between impressions (visibility) and clicks (engagement) to diagnose drops.
The SEO Friction
Simple click reports hide the 'why' behind traffic changes—is it a ranking drop or a search demand shift?
The Data Evidence
Taggable trend lines reveal if impressions are growing while clicks fall, indicating a CTR or relevance issue.
The Strategic Action
Isolate the specific date a trend broke to investigate technical or algorithmic causes.
The Business Outcome
Earlier detection of traffic decay and more accurate diagnosis of the root cause.
Step 3
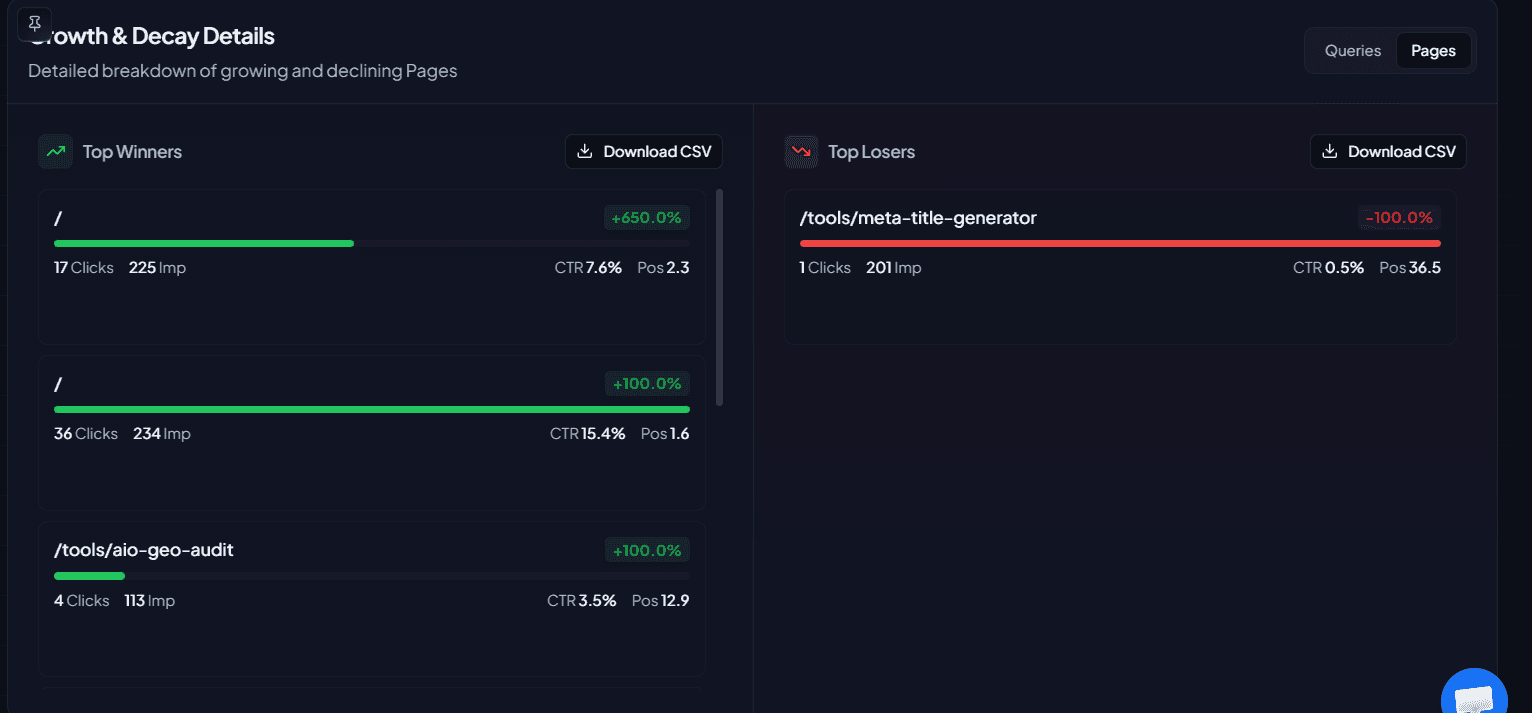
Prevent growing pages from masking declining pages that need urgent attention.
The SEO Friction
In aggregate data, big winners hide big losers, leading to delayed responses to critical traffic drops.
The Data Evidence
Automatic split of growth vs. decay URLs, showing exactly where your site is bleeding traffic.
The Strategic Action
Immediately triage declining high-value pages for content refreshes or technical fixes.
The Business Outcome
Optimized resource allocation and faster recovery of at-risk organic revenue.
Step 4
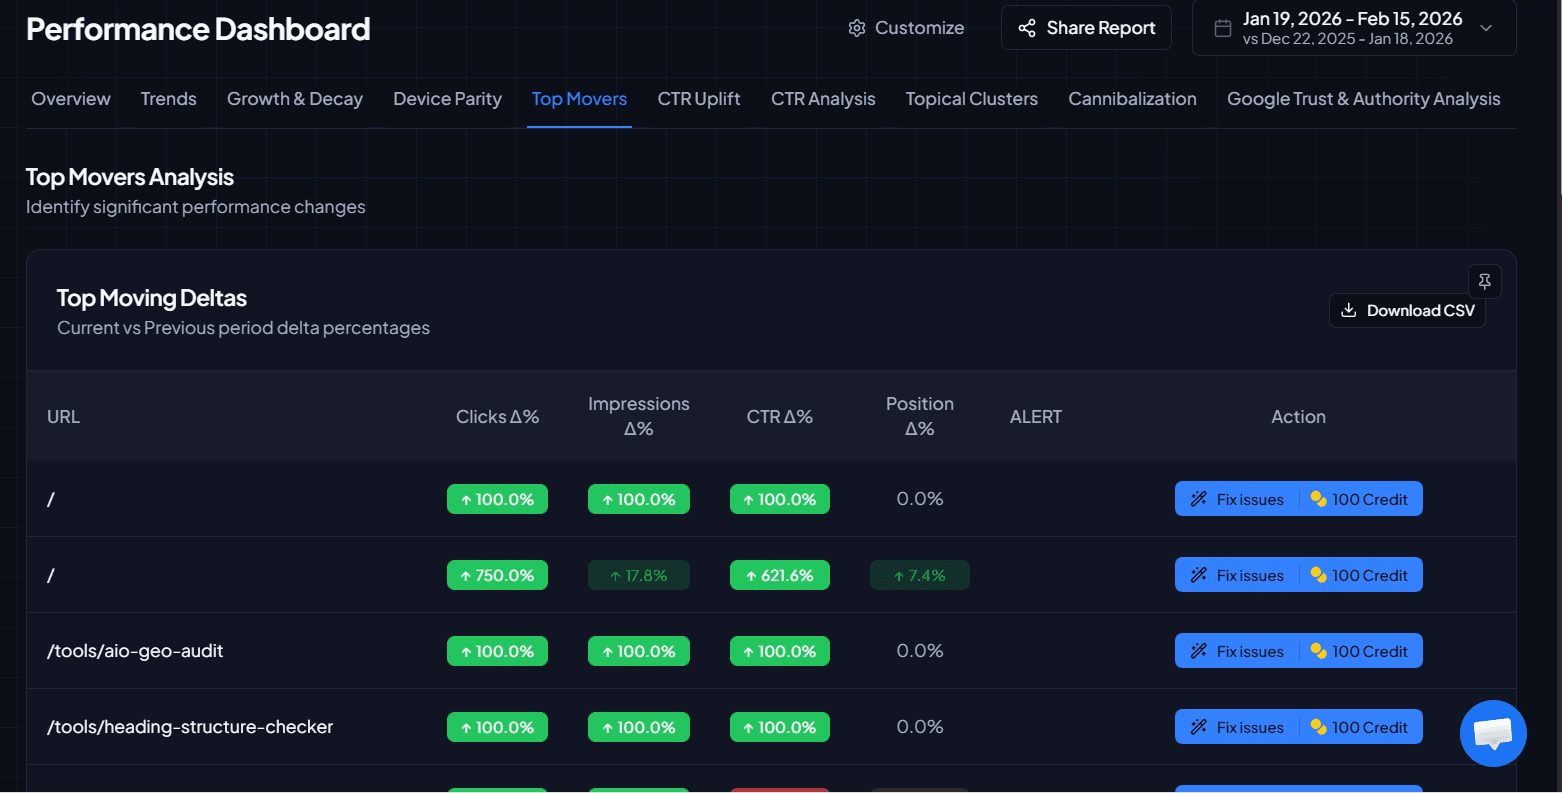
Decisions must be based on exact deltas, not generic 'up' or 'down' summaries.
The SEO Friction
SEO backlogs get filled with low-impact tasks because teams can't prove which pages changed the most.
The Data Evidence
A detailed delta table showing absolute changes in Clicks, Impressions, CTR, and Position per URL.
The Strategic Action
Prioritize pages with the largest negative click deltas but stable impressions (CTR opportunities).
The Business Outcome
Maximum ROI from every editorial sprint by fixing the highest-impact movers first.
Step 5
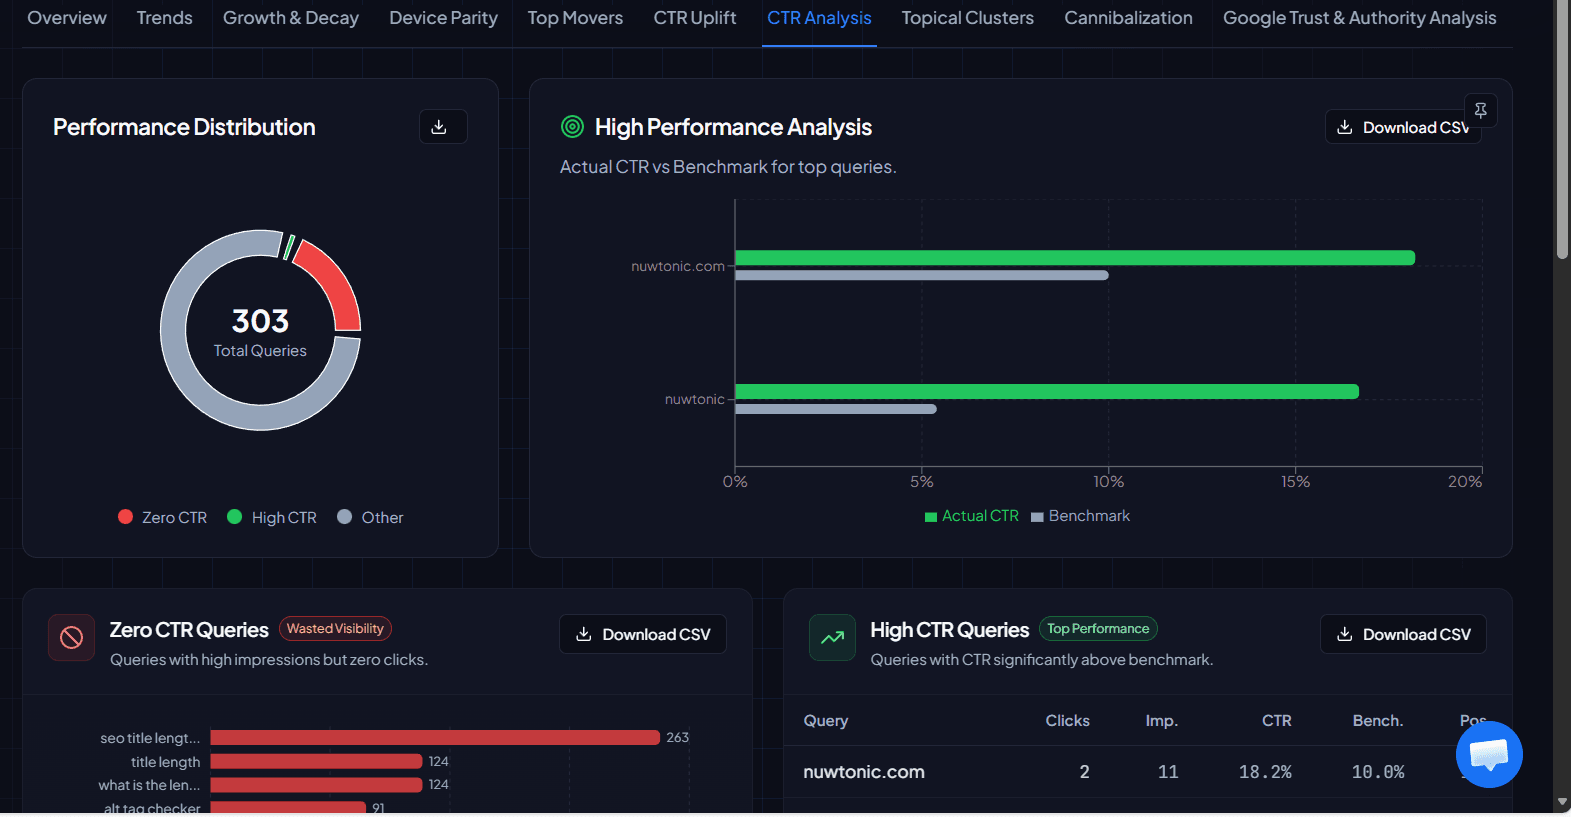
High impressions without clicks represent expensive, wasted search visibility.
The SEO Friction
Ranking on page 1 is useless if your title and meta description aren't winning the click.
The Data Evidence
Scatter plots and tables identify 'low-hanging fruit' queries with high visibility but sub-par CTR.
The Strategic Action
Rewrite snippets and optimize title tags for high-impression queries to win back 'lost' clicks.
The Business Outcome
Instant traffic uplift without waiting for higher rankings or new content.
Step 6
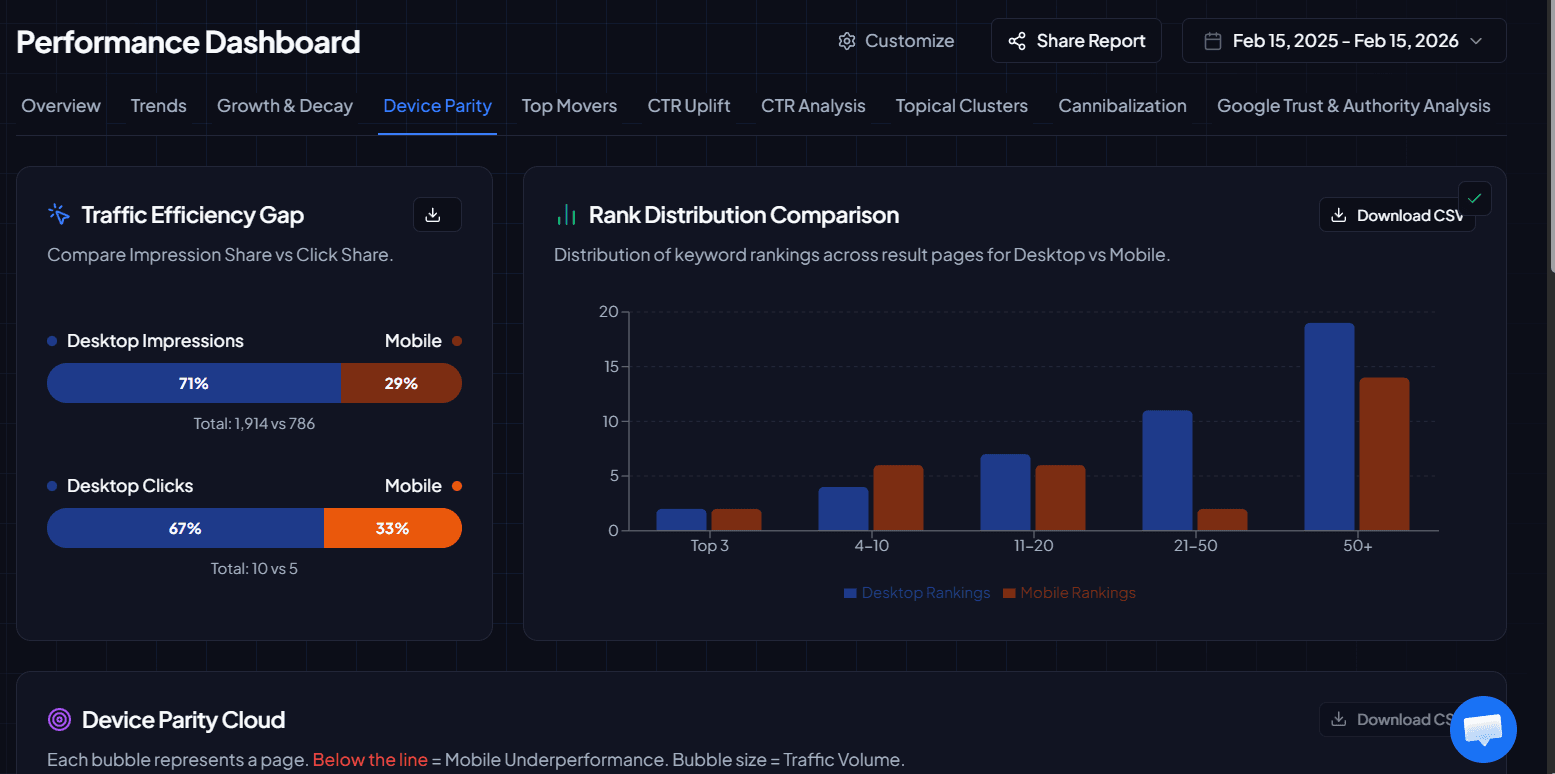
A site that looks fine on desktop may be suffering from severe mobile-only ranking penalties.
The SEO Friction
Teams often miss mobile-specific traffic drops because they only review desktop analytics.
The Data Evidence
Device-level distribution of clicks and impressions, highlighting gaps where mobile lags behind desktop.
The Strategic Action
Prioritize technical mobile fixes or mobile UX improvements where parity gaps are widest.
The Business Outcome
Improved mobile visibility and protection against Google's mobile-first indexing penalties.
Step 7
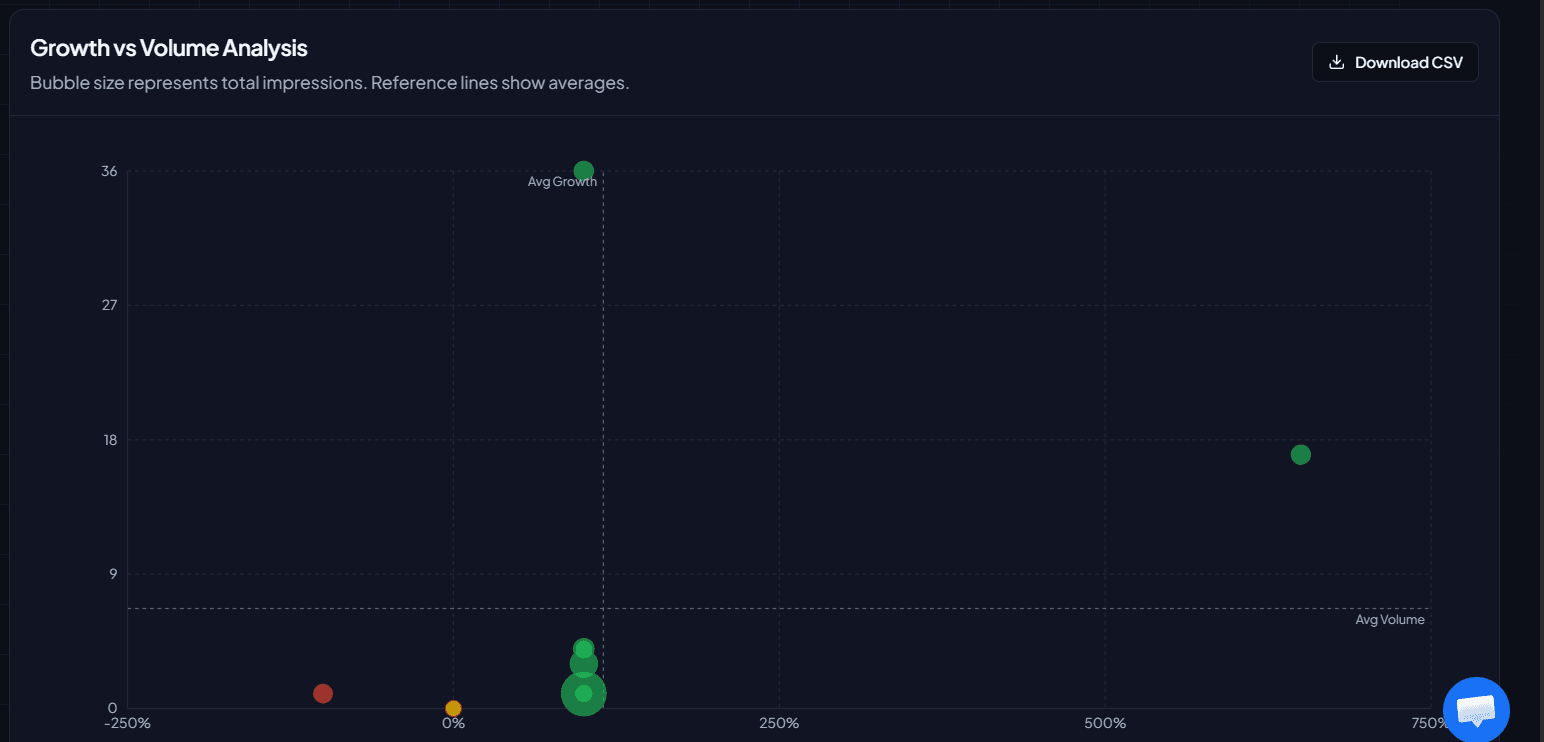
Not every page deserves the same amount of your team's time.
The SEO Friction
Teams waste weeks optimizing low-volume pages while high-potential pages go untouched.
The Data Evidence
A matrix plotting current growth momentum against total impression volume for every page.
The Strategic Action
Focus first on the 'High Volume / Low Growth' quadrant to unlock massive traffic gains.
The Business Outcome
Significantly higher efficiency for your content team and faster site-wide growth.
Step 8
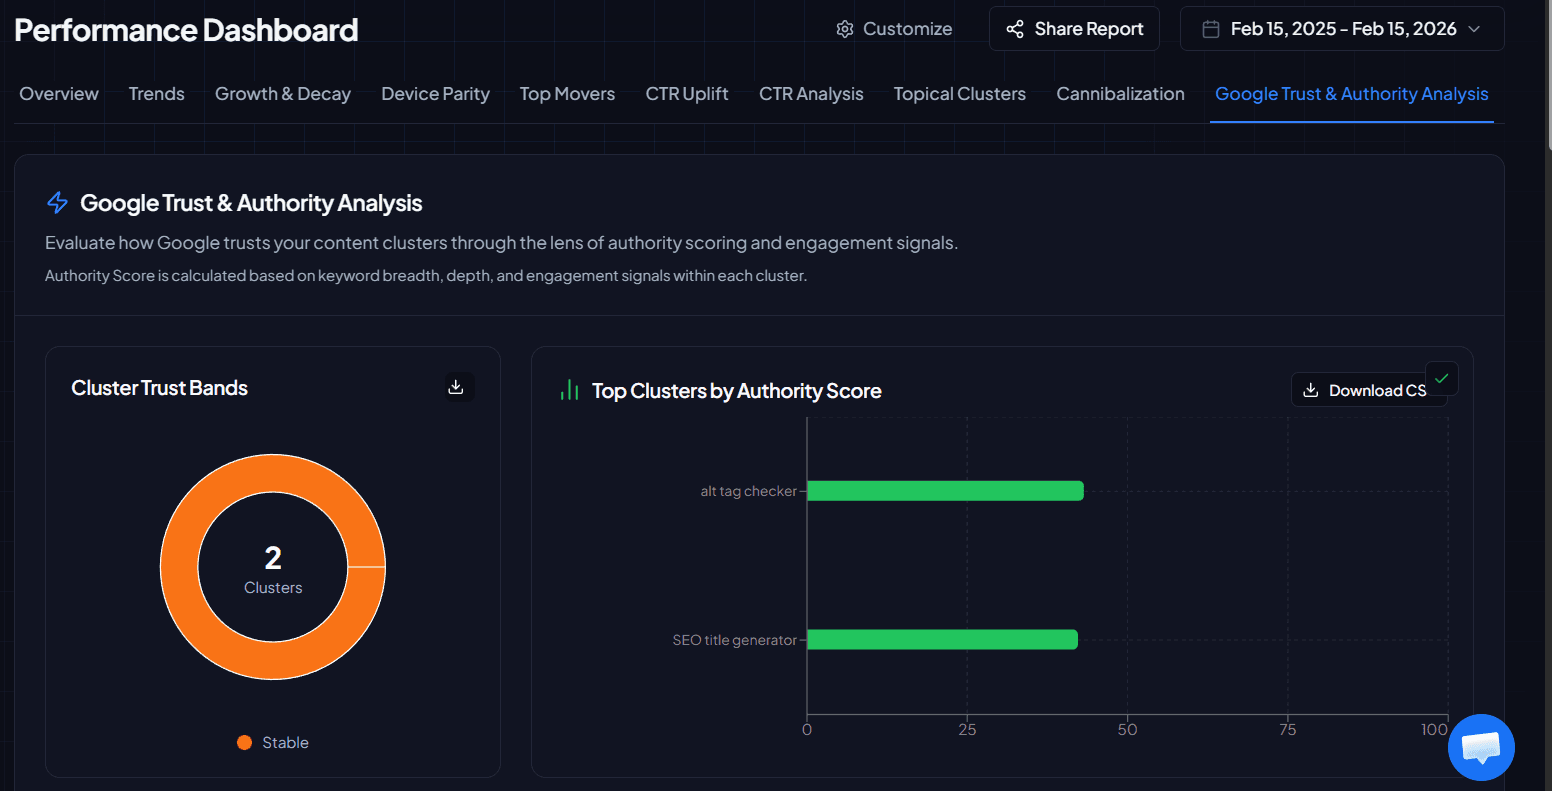
Google ranks sites that prove deep, topical authority, not just individual good pages.
The SEO Friction
Publishing fragmented content prevents you from building the 'Topic Trust' needed for competitive rankings.
The Data Evidence
Visual trust bands show where your site is perceived as an authority vs. where you are a 'thin' competitor.
The Strategic Action
Double down on content clusters with high trust to solidify your market dominance.
The Business Outcome
Long-term resilience against algorithm updates and more stable top-tier rankings.
Step 9
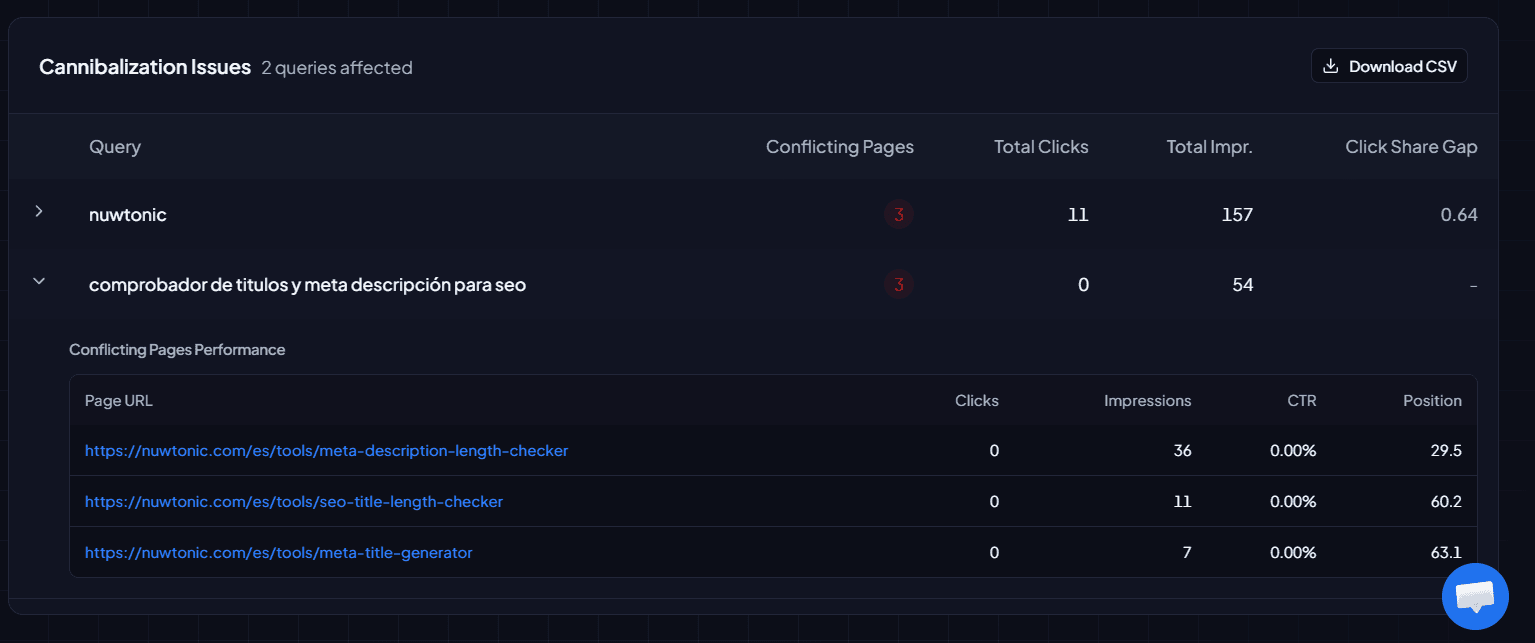
Multiple URLs targeting one keyword dilute your ranking power and confuse search engines.
The SEO Friction
Cannibalization causes rankings to 'flip-flop' between URLs, resulting in unstable traffic and lower CTR.
The Data Evidence
Detection of queries where Google is forced to choose between multiple pages on your site.
The Strategic Action
Consolidate content or refine internal linking to signal a single 'master' URL per topic.
The Business Outcome
Stronger, more stable rankings and a cleaner, more authoritative site structure.
Step 10
You need definitive proof that your SEO efforts are actually working.
The SEO Friction
SEO leads struggle to prove their value to stakeholders without clear 'before vs. after' evidence.
The Data Evidence
Overlay charts comparing current performance against a previous period (PoP) or previous year (YoY).
The Strategic Action
Keep and scale successful strategies; pivot away from tactics that show no measured uplift.
The Business Outcome
Higher executive buy-in for SEO budgets and data-backed proof of your team's success.
Follow this 5-step funnel to turn your GSC data into a high-performance growth engine.
Integrate: Connect your GSC properties to Nuwtonic to clean, normalize, and centralize your data.
Diagnose: Use Trends and Winners/Losers to immediately identify where you are bleeding revenue.
Prioritize: Filter by ROI leverage and CTR gaps to find the optimizations with the fastest payoff.
Execute: Assign targeted fixes to your content and technical teams based on data evidence.
Validate: Use Period Comparison to prove your impact and report growth to leadership.
GSC is a data source; Nuwtonic is a decision system. We take the raw data and add visualization, delta analysis, prioritization matrices, and authority tracking that GSC doesn't provide.
Yes. Every module is built with delta-first thinking, allowing you to compare any two periods with a single click to see absolute and percentage changes.
Absolutely. Our cannibalization module automatically flags queries where multiple URLs are competing, helping you consolidate ranking power.
Our 'Growth vs. Volume' matrix and 'Lost Demand' (CTR) analysis identify exactly which pages have the most to gain from optimization, ensuring your team works on high-impact tasks first.
New to agentic SEO?
Read the definitive guide to agentic SEO and see how every Nuwtonic module fits into one execution loop.
Stop drowning in GSC exports. Give your team the visual dashboard they need to execute with confidence and recover lost traffic today.